Tuesday, October 13, 2015

Tuesday, May 7, 2013
S&P 500 chart looks scary too.

S&P 500 chart looks scary too.
Last 2 times (2000, 2008) trend lines were broken.
We have only 50% in stocks and waiting for the trend line to break below the red box, to sell the next 50%
It should happen later this year or early next year.. still a little room to grow.
Gold on a Monthly chart.. target of $700/oz by 2020

Gold is at the cross roads and we stopped following since Aug 2012. see 33 year chart
Monthly chart looks scary. The probability of touching the break out of cup is very high, which is $700/oz, in another 5-6 years. European Countries (EURO) is completely broken and some weaker countries collateral will be called in the next 2-3 years. Hence Gold market is expecting a sell off and big funds are dumping.
Asian countries like India will witness a real correction in Gold and Real estate prices in the future. Real estate prices are artificial in India and China and will burst as the bubble blows up.. be prepared.. Invest in US$$, Housing stocks
Thursday, April 11, 2013
FaceBook (FB) - Target $38
FaceBook (FB) is undergoing Cup & Handle Text Book Pattern.
JAN 2014 target is $38 and above. FB Home is a direct stab at Google advertisements. It is too early to tell. We suggested FB $32 JAN CALLS on 04/01 for $1. These are selling for $2 today..
We expect to make $6- $8 on our investment by OCT 13

JAN 2014 target is $38 and above. FB Home is a direct stab at Google advertisements. It is too early to tell. We suggested FB $32 JAN CALLS on 04/01 for $1. These are selling for $2 today..
We expect to make $6- $8 on our investment by OCT 13
Wednesday, April 10, 2013
Infosys earnings 04/12/13 : expecting a 10% move by 04/20 expiry
We expect INFOSYS (INFY) to close at $47.5 or below by April options expiration, based on the options traded last 10 days. we saw institutions selling $55 April calls and buying $55 May calls.
There will be a trade idea tomorrow by 2PM CST.

There will be a trade idea tomorrow by 2PM CST.

Friday, January 11, 2013
How we nailed Infosys Earnings? (17 of 20 earnings right)
How we nailed Infosys Earnings? (17 of 20 earnings right)
How $0 investment made $5300 profit
We always participate before the event happens, not after the event.
Infosys(INFY) went up 19% on the NYSE today. How was our system set up to capture the movement?

Yesterday we had a meeting about the Technical analysis and noticed the Big Hedge Funds buying calls & selling puts.
We had 2 options to capture the gain :
1) Buy 1000 shares of INFY at $44 for $44000 to make profit of $8,200 (INFY went up $8.27) or loose how much ever it looses. We dont like this.
2) Buy Feb 13 - $47.5 calls for $0.55, total $550 for 10 contracts (1 US Contract=100 shares). We sold these for $4.80 making 900% profit overnight.
3) Sell Feb 13 - $40 puts for $0.55, collect total $550 for 10 contracts (1 US Contract=100 shares). We bought these back for 5 cents making 1000% profit overnight.
Add 2 & 3.. For $0 investment we made $5300 profit.
See the picture of these contracts in one of our accounts.

Saturday, January 5, 2013
Infosys Jan 2013 options analysis
Infosys Jan 2013 options analysis - This is a free trade, we give out every quarter
Let us look at where smart money is thinking infosys will end up before third Friday of Jan 2013.
 There are 8360 contracts sold at $45 - This suggests INFY will not go more than $45.
There are 2900 puts at $57.5 which are worth ($14.8x2900x100=$4.2million) some one who is confident this will go down further is holding the position
There are 5400 $40 contracts at $0.7 . If this Hedge fund has to make a profit on its investment, Infosys has to close below $39 on Jan Expiry. This is possible and we will go with this option, but wait for last minute buyers on Thu..
Final target for Infosys in 2013 is $28-29
Let us look at where smart money is thinking infosys will end up before third Friday of Jan 2013.

There are 2900 puts at $57.5 which are worth ($14.8x2900x100=$4.2million) some one who is confident this will go down further is holding the position
There are 5400 $40 contracts at $0.7 . If this Hedge fund has to make a profit on its investment, Infosys has to close below $39 on Jan Expiry. This is possible and we will go with this option, but wait for last minute buyers on Thu..
Final target for Infosys in 2013 is $28-29
Gold at cross roads again
Gold at cross roads again -
As mentioned earlier Gold is at cross roads and on the verge of breaking down from its peak of $1943/oz on AUG 2011.

Gold is in a circle similar to 2009, now it is different. it is on the path to $1400/oz pretty soon.
There are rumors no new $$$ is printed..
India :
As Gold kept falling (-20% from AUG 2011 $1943/oz) Genius Indian government kept depreciating the Rupee to Rs55/$ and keep Gold rates steadily increasing at Rs 32,000/10gms the highest so far. Reason, in India if Gold rate comes down, real estate will follow and banks will become pauper (Bankrupt)..
We think Rupee can touch Rs60/US$ by mid 2013.. and the US$ keeps getting stronger.
No much movement seen in Gold. so no ideas on Gold & Silver.
Tuesday, December 11, 2012
Gold is at cross-roads like in OCT 2008
Gold is the similar circle that was in OCT 2008. Will it break up or end down.
We don't think it will break down. It will get to $2000/oz in a year. (only in US $, no estimates in Indian Rupee)
In 2008 crisis US had to print another $5Trillion and has now ended in $16Trillion debt.
Today it is no different, we need $4 Trillion more in the next 4 years.. Gold has been down 20% since Aug 2011 and it is expected a big move. probably to upside. Wait for confirmation in the next 2-3 weeks. It has to produce a weekly bar in the weekly chart below.

Monday, October 22, 2012
Infosys's Capitalism introduced into a Socialist country like India. Is it working?
Infosys's Capitalism introduced into a Socialist country like India. Is it working?
Picture says 1000 words. We pulled up chart of Infosys and Wipro from Feb 2000 till today.
Infosys was at $92 on Feb 2000 and after all split adjusted and dividends, it is worth $44 today, what this means if would have invested $92 in the great NRN's Capitalism Vision of Infosys, your money is worth only $44 today. It will take another 30-40 years for Infosys to get back to $92, if at all Infosys exists in its present form. Charts says it all.. where Infosys is heading towards.. Collapse like Kingfisher Airlines
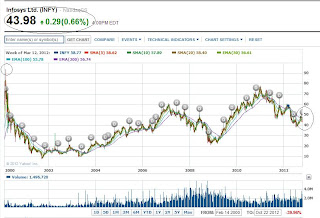

Picture says 1000 words. We pulled up chart of Infosys and Wipro from Feb 2000 till today.
Infosys was at $92 on Feb 2000 and after all split adjusted and dividends, it is worth $44 today, what this means if would have invested $92 in the great NRN's Capitalism Vision of Infosys, your money is worth only $44 today. It will take another 30-40 years for Infosys to get back to $92, if at all Infosys exists in its present form. Charts says it all.. where Infosys is heading towards.. Collapse like Kingfisher Airlines

Wipro : If would have invested $6 in Wipro in Feb 2000, it is worth $8.2 now after all splits and dividends. Does it makes sense in Premji's Socialism.. Yes your money is inflation adjusted for 2-3% and will grow sequentially. Believe in Socialism now.

Wednesday, August 29, 2012
AAPL : Updates 08/29/12
APPL continues strong towards our target of $850 by JAN 2013. See P&F charts

This week we saw $$$ flow from AAPL to GOOGLE, this is temporary and will change next week.
AAPL is basing on the 60 minutes for a breakout to $740 next month. See Weekly charts. AAPL is one of the cheapest stock in S&P 500 and it will continue to grow next 3 years for a price target of $1500
On the IRA accounts we are holding till $800, sell and buy lower after a 10% correction (which may not come as per weekly charts in 2012)
Weekly trading accounts are managed as per the 60 minutes charts.. sell begining of week and buy on Wed evening is working out well.


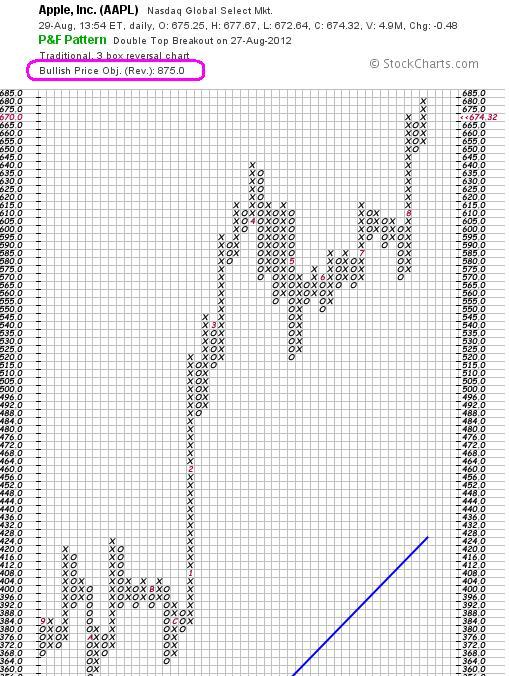
This week we saw $$$ flow from AAPL to GOOGLE, this is temporary and will change next week.
AAPL is basing on the 60 minutes for a breakout to $740 next month. See Weekly charts. AAPL is one of the cheapest stock in S&P 500 and it will continue to grow next 3 years for a price target of $1500
On the IRA accounts we are holding till $800, sell and buy lower after a 10% correction (which may not come as per weekly charts in 2012)
Weekly trading accounts are managed as per the 60 minutes charts.. sell begining of week and buy on Wed evening is working out well.


Wednesday, August 1, 2012
FaceBook (FB) - Our suggestion on IPO? where we are now?
We suggested not to buy FaceBook IPO at $44 on the opening day. Our target was $14. But some of you bought it. Also I got couple of hate emails and on my Facebook page regarding our suggestion.
Let us do a reality check today :- FaceBook (FB) is at $20.90 down from $44.00. We think it will go to $14 as suggested on the IPO day. It can comeback to $20 and then again $4-$8 range in the next 12 months.. yes $4 you heard it. Remember the lockup period and additional 250 million insider selling on Aug 12 2012.

Your comments are welcome.. we value your opinion.
Venkatesh K
Monday, July 16, 2012
GOLD-07-15-2012
GOLD-07-15-2012.
Many people ask about GOLD. Is it a Buy?
Our Analysis is based on US $ only. We buy 1 oz bars only. We started from $260 in 2002
We will provide some views in terms of Indian National Rupee (INR) and cannot guarantee in INR as the Indian Policies change every minute and a dysfunctional & corrupt governments add to the illegal demand for Gold in India
Gold is in Bear mode since August 2011 from $1943/oz and today it is at $1570. It has lost nearly 20% of its value due to US $ strengthening against the major Currencies (Please see US $ chart below). 13week Moving Average(MA) has crossed below 65 Week MA. This happened only once in last 10 years Aug 2008 and stayed there for 8 months.
We think it will take another 4-6 months and may touch $1400/oz intra day. That will be your next buy. We have a target of $3500-$4000/oz in the next 5-8 years. downside is limited.
Weekly chart of GOLD Contracts on the Chicago Mercantile Exchange(CME).

In India, price of Gold is Rs 30,000/10 gms from Rs 31,700. You seem to wonder why it has not changed? Our RBI Governor has brains of Chanukya. When Gold was $1940 in August 2011 on CME, minuscally traded Rupee was fixed @Rs44/US$. This translates to $1940 X Rs 44= Rs 85360 /oz (bar) ..
As Gold started dropping 20% in the international market, RBI started to artificially devalue the Rupee, by keeping high interest rates. Today Gold in India is $1570 X Rs 55= Rs 86350 /oz (bar) .. WOW no change
If RBI would not have done this and GOLD in India would have fallen 20%, real estate would have collapsed by equal amount. Hence the Rupee is at 55 today.
How long will it be at 55? let us analyse further
If you analyse the 10 year Weekly chart of USD, it has been on a decline, we think it will touch the Upper channel of 86 in the next 2-3 months.. may not be.. At that time we expect Indian Rupee to be at Rs60/USD. Plan your remittances then.
Last year we told Rupee will touch 55 when it was @44, some people laughed.. ok wait and see.

Please leave comments..
Venkatesh
INFOSYS (INFY) reports on 07/12/12 AM
Trade idea - Buy the July $45 puts for $2.50 before 07/11/12 close. We are expecting INFY to go down $6 to $38 on Thu.
Sell the July $45 puts for $7.00 and higher on 07/12/12 AM.

I am opening this idea for all users. Many reported they made 200-250% the next day.
We have nailed INFY correctly for 6 out of last 7 reporting quarters.
Subscribe to:
Posts (Atom)